Leveraging Analytics: Turning Your SME Data Into Business Growth

As an SME owner or manager, you already make decisions every day: which products to stock, which services to push, which customers to focus on, where to cut costs, and where to invest.
Analytics is simply a way to make those decisions less guesswork and more evidence-based.
You don’t need to be a data scientist, hire a big IT team, or invest in expensive software to benefit from analytics. With the tools you already use – accounting software, spreadsheets, website stats, and simple dashboards – you can start turning day‑to‑day data into clear insights that drive growth.
Techease helps SMEs set up exactly this kind of practical analytics foundation – from starter dashboards to more advanced analytics and AI pilots as you grow. This guide will show you how to get started in a way that’s realistic for a busy SME.

What “Analytics” Really Means for an SME
In simple terms:
Analytics = looking at your business data in a structured way so you can spot patterns, answer questions, and make better decisions.
For SMEs, that usually means:
- Seeing which products, services, or clients are most profitable
- Understanding which marketing channels actually bring paying customers
- Tracking where time or money is being wasted
- Monitoring a few key numbers (KPIs) on a regular dashboard
Common SME challenges
Most SMEs face similar obstacles:
- Limited time: You’re busy running operations; deep analysis often gets postponed.
- Limited budget: You can’t justify expensive analytics platforms or large teams.
- Scattered data: Information sits in different places – accounting tools, POS, CRM, Excel files, email marketing, etc.
- Low visibility: You get reports, but they’re either too high-level or too detailed to be useful.
The good news: with a small set of focused questions, a simple data structure, and the right dashboards, you can:
- Increase revenue (by promoting the right products or services)
- Reduce costs (by spotting waste or low‑value activities)
- Improve efficiency (by identifying bottlenecks and fixing them)
- Strengthen customer retention (by understanding who leaves and why)

Step 1: Start with Business Questions, Not Just Data
A common mistake is to start by asking:
“What data do we have?” and then getting lost in spreadsheets.
Instead, start with:
“What decisions do we want to improve?”
Think in terms of business questions. Here are practical examples by sector.
Retail SME examples
- Which products or categories give us the highest profit, not just the highest sales?
- What days or hours are our busiest – and are we staffed correctly?
- Which stores or branches are underperforming and why?
Service businesses (e.g., agencies, consultancies, trades)
- Which types of projects have the best margins?
- Which clients are profitable once we factor in support and revisions?
- How much time is spent on billable vs. non‑billable work?
E‑commerce SMEs
- Which traffic sources (Google, social media, email) bring customers who actually buy, not just click?
- What is our cart abandonment rate, and where do people drop off?
- How does delivery time or shipping cost affect repeat purchases?
B2B SMEs
- Which industries or company sizes are easiest to convert into paying clients?
- How long does it take to move from lead to closed deal?
- Where in our sales pipeline are we losing the most opportunities?
Write down 3–5 questions that matter most for the next 3–6 months. This list becomes your analytics roadmap.
Step 2: Map and Collect the Right Data
Once you know your questions, you can work backwards to ask:
“What data would help answer this?”
Where your data usually lives
Typical SME data sources include:
- Accounting / Finance tools
Xero, QuickBooks, Sage, or similar
– Revenue, costs, invoices, payment timing, margins. - Point of Sale (POS) systems
For retail, F&B, and physical stores
– Product sales, time of sale, location, staff, discounts. - Customer Relationship Management (CRM)
HubSpot, Zoho, Pipedrive, Salesforce, or simpler tools
– Leads, deals, stages in pipeline, win/loss reasons, contact history. - Website & online store platforms
Google Analytics / GA4, Shopify, WooCommerce, Wix, Squarespace
– Visitors, page views, conversion rate, top pages, traffic sources. - Marketing platforms
Meta Ads, Google Ads, LinkedIn Ads, Mailchimp, Klaviyo, etc.
– Clicks, impressions, cost per click, email open & click‑through rates. - Spreadsheets
Excel or Google Sheets
– Often used to track custom lists: projects, inventory, staff hours, manual reports.
Many SMEs already have years of useful data sitting in these systems – it just hasn’t been pulled together or visualized.
Basic data cleaning (without getting technical)
You don’t need advanced data engineering. A few simple rules will make your data much more usable:
- Consistent dates
- Use a single date format (e.g.,
YYYY‑MM‑DD). - Avoid mixing text like “Jan 3” with “3/1/24”.
- Make sure time zones are consistent if you work across regions.
- Use a single date format (e.g.,
- Consistent names
- Use one name for each product, service, or client.
- Avoid variations like “ABC Co.” vs “ABC Company Pte Ltd”.
- Consider maintaining a simple master list in a sheet.
- Consistent units
- Don’t mix currencies in one column; if you must, clearly convert and document.
- Use one unit for quantities (e.g., all in pieces, or all in kg).
- Avoid free‑text where structure is needed
- Use dropdowns or categories where possible (e.g., “Industry”, “Region”, “Status”).
- This makes analysis and filtering straightforward later.
You can start with monthly exports from each system into Excel or Google Sheets to build your first version of a “single source of truth”.
As your needs grow, Techease can help you move from basic exports to more automated data pipelines and dashboards, including starter analytics setups with tools like Microsoft Power BI or Google Data Studio / Looker Studio.
Step 3: Choose Accessible Tools and Dashboards
You don’t need enterprise tools to get value from analytics. Many powerful options are free or low‑cost.
Practical tool categories for SMEs
- Spreadsheets (Excel / Google Sheets)
- Pros: Familiar, flexible, low‑cost, great for early-stage analysis.
- Use for: First reports, basic charts, pivot tables (e.g., sales by product, month, or region).
- Dashboard & reporting tools
- Google Looker Studio (formerly Data Studio) – Free, connects to Google Analytics, Google Sheets, and many other sources.
- Microsoft Power BI – Low‑cost, especially if you already use Microsoft 365. Good for richer dashboards and combining multiple data sources.
- Tableau – More powerful, often used when you need complex visuals and have more advanced users.
- Built‑in dashboards from SaaS tools
- Many tools you already use (Shopify, Xero, HubSpot, Mailchimp, etc.) include basic dashboards.
- Start by using these better, then combine them later in a central view.
Techease frequently helps SMEs choose and set up the right mix of these tools – from starter analytics dashboards in Power BI or Google Data Studio / Looker Studio to more advanced analytics and AI/ML pilots as they scale.

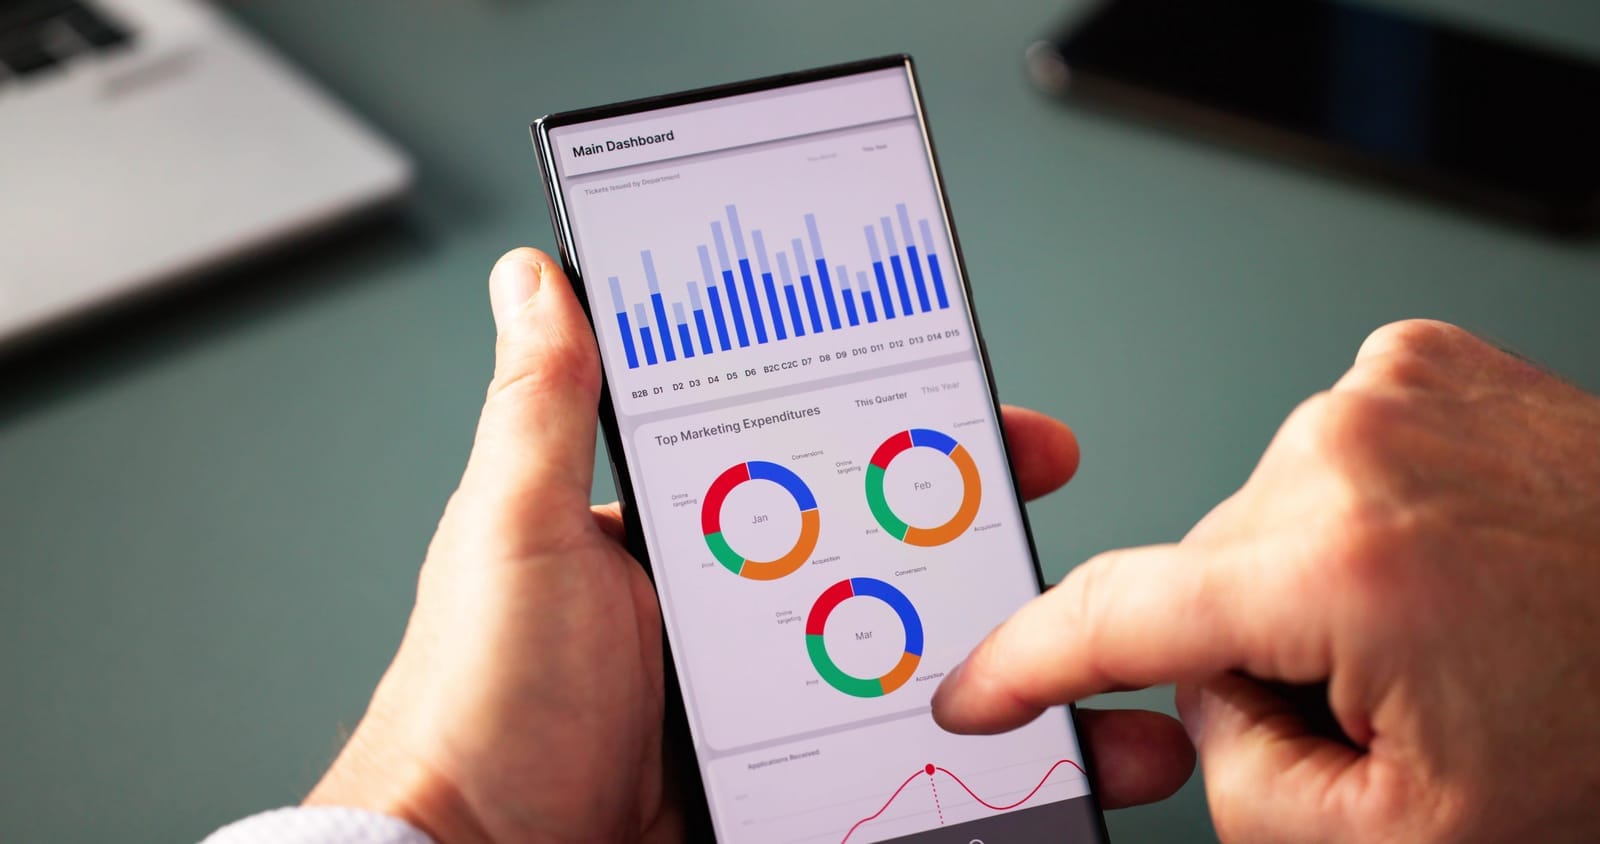
What is a dashboard, really?
A dashboard is a single screen that shows your most important numbers and charts in a simple, visual way.
Think of it as your digital business cockpit:
- You can see key metrics at a glance
- You can spot issues early (e.g., a sudden dip in sales or spike in customer churn)
- You can share it with your team so everyone sees the same reality
What makes a good SME dashboard?
A good dashboard:
- Focuses on a small set of KPIs (not 50 charts)
- Uses simple visuals: bar charts, line charts, simple tables
- Uses clear labels (“Monthly Revenue”, “New Customers”) instead of jargon
- Shows trends over time, not just one month
- Uses traffic‑light colours sparingly to highlight issues (e.g., red for below target)
- Is easy enough that a non‑technical manager can read it in under 2 minutes
Start with one dashboard per key area, for example:
- Sales & Revenue Dashboard
- Marketing & Lead Generation Dashboard
- Operations / Service Delivery Dashboard

Step 4: Define and Track a Small Set of KPIs
A KPI (Key Performance Indicator) is a number that tells you whether you’re making progress towards a specific goal.
You don’t need many. In fact, 3–7 KPIs per area is plenty.
Common SME KPIs (you can pick from these)
Sales & Revenue
- Monthly Revenue – Total sales per month.
- Revenue Growth % – How much revenue increased or decreased vs. last month/last year.
- Average Order Value (AOV) – Total sales ÷ number of orders.
- Sales by Product / Service – Revenue and margin from each offering.
Marketing & Customers
- Customer Acquisition Cost (CAC) – Marketing + sales costs ÷ number of new customers.
- Conversion Rate – Percentage of leads/visitors who become paying customers.
- Repeat Purchase Rate – Share of customers who bought more than once in a period.
- Customer Lifetime Value (CLV or LTV) – Total expected revenue from a typical customer over the relationship.
Operations & Projects
- Project Margin – (Project revenue – direct costs) ÷ revenue.
- On‑time Delivery Rate – % of orders or projects delivered on or before promise date.
- Utilization Rate (for services) – Billable hours ÷ total available hours.
Financial Health
- Gross Margin %
- Operating Expenses as % of Revenue
- Average Days to Get Paid (DSO)
Why tracking KPIs over time matters
Looking at one month in isolation tells you little. Trends are what matter.
By tracking KPIs each week or month, you can:
- Spot early warnings (e.g., conversion rate dropping, CAC rising)
- Validate experiments (e.g., did that new promotion actually increase AOV?)
- Prioritize actions (e.g., if you see strong revenue but weak margins, you’ll focus on costs)
Techease’s SME‑focused services include setting up KPI dashboards and regular reviews – from starter analytics setups to more advanced KPI monitoring and analytics projects as you grow.

Step 5: Turn Insights into Concrete Actions
Analytics only creates value when it changes what you do.
Here are practical examples of how SMEs can turn simple data into action.
Example 1: Using sales data to decide what to promote or discontinue
Scenario: A retail store exports monthly sales data from its POS to Excel.
They analyse:
- Units sold per product
- Revenue per product
- Gross margin per product
Insight:
- Product A sells many units but has low margin
- Product B sells fewer units but has very high margin
- Product C has low sales and low margin
Actions:
- Promote Product B more (better display, online promotion, bundle deals).
- Review pricing or sourcing for Product A to improve margin – or use it as a “loss leader” intentionally.
- Discontinue or replace Product C, freeing up cash and shelf space.
Result: Same store, same staff, but a more profitable product mix.
Example 2: Using customer data to improve retention and upsell
Scenario: A B2B service firm uses a CRM to track clients and revenue.
They look at:
- Which clients have not purchased in the last 6–12 months
- Which services each client currently uses
- Revenue by industry and company size
Insights:
- Several long‑time clients have stopped sending work in the last 9 months.
- Clients that use 2 or more services have much higher lifetime value and stay longer.
Actions:
- Create a simple “at‑risk clients” list and reach out personally.
- Build bundled offers (e.g., design + maintenance, or consulting + training) to encourage multi‑service adoption.
- Train account managers to offer complementary services systematically during reviews.
Result: Higher retention and average revenue per client, without increasing marketing spend.
Example 3: Using operational data to reduce bottlenecks and waste
Scenario: A services SME tracks project timelines and staff hours in a spreadsheet.
They measure:
- Estimated vs. actual hours per project phase (e.g., design, build, testing)
- Delays and reasons for delay
Insights:
- Projects often overrun during the handover phase, where information is incomplete.
- A few specific tasks repeatedly require rework.
Actions:
- Standardise a handover checklist to ensure key information is complete before the next phase starts.
- Create templates or SOPs for tasks that often require rework.
- Review whether some low‑value tasks can be automated (e.g., using simple tools or scripts).
Over time, Techease can help identify and implement targeted process automations, especially under more advanced service tiers that include process automation and analytics projects.
Result: More projects delivered on time, fewer hours wasted, and better margins.
Embrace “test, measure, improve” cycles
You don’t need to get it right on the first try. Use this loop:
- Test
Try a change – a new promotion, a revised process, a different pricing structure. - Measure
Track the relevant KPI (e.g., conversion rate, AOV, on‑time delivery, margin) for a few weeks. - Improve (or stop)
- If results are better, keep and refine the change.
- If not, stop and try something else.
Analytics turns your business into a learning machine instead of a series of one‑off guesses.

Step 6: Start Small and Build a Data Culture
You don’t need a “big bang” analytics project. In fact, it’s usually better not to.
Start with one or two dashboards
Pick one area to focus on first:
- If growth is your priority: start with a Sales & Marketing dashboard.
- If profitability is the issue: start with Margins & Costs.
- If customer churn is worrying: start with a Customer Retention dashboard.
Build a simple dashboard that answers 3–5 key questions you wrote down in Step 1. As your team gets used to it, you can add more detail gradually.
Techease offers starter analytics setups, KPI dashboards, and ongoing analytics projects designed exactly for this staged, low‑risk approach.
Involve your team
Analytics shouldn’t live in the owner’s inbox alone. Even a small team can benefit if you:
- Share dashboards
Give managers and key staff access to view dashboards (read‑only) in Power BI, Looker Studio, or even shared Google Sheets. - Review metrics regularly
Add a 10–15 minute “numbers check‑in” to your:Cover:- Weekly operations meeting
- Monthly management meeting
- What changed vs. last period?
- What surprised us?
- What will we do differently as a result?
- Encourage questions, not blame
Use analytics to understand and improve processes, not to punish individuals. This builds trust and adoption.
Simple governance habits
You don’t need complex data governance frameworks. A few simple rules go a long way:
- Ownership
- Assign one person as the “data owner” for each dashboard (it can be part‑time).
- They don’t need to be a specialist; they just oversee updates and consistency.
- Update schedule
- Decide how often data should refresh:
- Weekly (e.g., for sales and marketing)
- Monthly (e.g., for financial KPIs)
- Automate as much as possible – even basic scheduled exports are a start.
- Decide how often data should refresh:
- Central storage
- Keep important data files and dashboards in a shared, labelled folder (e.g., “Company Analytics” in OneDrive/SharePoint/Google Drive).
- Avoid having “final_report_v7.xlsx” on someone’s desktop where no one else can find it.
- Documentation
- Maintain a simple “Data & Dashboard Guide” (a one‑page doc) that lists:
- What each dashboard shows
- Where the data comes from
- When it’s updated
- Who to ask for help
- Maintain a simple “Data & Dashboard Guide” (a one‑page doc) that lists:
As your analytics maturity grows, Techease can support you with more advanced analytics, AI/ML pilots, and regular strategy workshops to keep your data efforts aligned with business goals.

How Techease Can Help You Take the Next Step
If you’re reading this and thinking, “This sounds valuable, but I don’t have time to set it all up,” you’re not alone.
Techease works with SMEs at different stages of their analytics journey, offering:
- Starter analytics setups – Basic dashboards in tools like Microsoft Power BI or Google Data Studio/Looker Studio to monitor your key KPIs.
- Custom dashboard and KPI monitoring – Tailored dashboards that connect to your accounting, CRM, POS, and marketing systems, plus ongoing analytics support.
- Advanced analytics and AI/ML pilots – For growing SMEs ready to experiment with predictive models, advanced segmentation, or process automation.
- vCIO/vCTO engagement – Regular strategic sessions to align your IT and analytics investments with your growth plans and budget.
You can start small – with just one or two dashboards – and scale up as you see real value in better, data‑driven decisions.
Final Thoughts: Analytics as a Practical Growth Tool, Not a Buzzword
Analytics isn’t about flashy charts or complex models. For SMEs, it’s about:
- Clarifying what you want to know
- Pulling together the data you already have
- Using simple tools to create clear dashboards
- Tracking a few key metrics over time
- Turning insights into concrete actions
If you do just that – consistently – you’ll already be ahead of many competitors.
Start with one question. Build one simple dashboard. Share it with your team. Review it regularly. Improve a little each month.
If you’d like support designing the right questions, setting up affordable tools, or building dashboards tailored to your SME, Techease can guide you from starter analytics to more advanced, growth‑driving insights.